Hi, I’m Rich from North Carolina in the United States, and I’m going to talk a little bit about visualizing sound.
We all have various reasons for wanting to visualize sound at different times. We may want to understand a natural phenomenon, or find an annoying harmonic so we can get rid of it, or figure out if the rhythm guitar is too loud, and needs to have its levels adjusted.
So how do we “see” sounds so we can understand them better?
Oscilloscopes
At first, we had oscilloscopes. What a hardware oscilloscope measures is the changes in a voltage signal over time. The signal strength is measured along the y-axis, and time progresses along the x-axis.
In terms of software, rather than as a voltage, we usually see the image of amplitude along the y-axis over time on the x-axis, since that’s more useful than voltage in terms of audio editing.
Either way, the oscilloscope is useful for measuring what is going to be sent out to your speakers, whether it’s in terms of voltage or amplitude. In our case, we’ll be using the amplitude variety more often.
Oscilloscopes are useful for finding the starts and ends of sounds, and for determining the average level of a sound, but they don’t give you any frequency or timbre data.
Spectrum Analysis
Next came the spectrum analyzer. The spectrum analyzer does a really good job of showing us an instantaneous snapshot of frequency and amplitude information. Generally, audio frequencies are lined up along the x-axis, and the y-axis measures the amplitude.
What the spectrum analyzer lacks is a way to show changes in frequency and amplitude over time.
In a DAW, you can often find spectrum analyzers available as add-on software.
Spectrogram/Sonogram
The spectrogram or sonogram has the richest presentation of audio data. It shows us frequency and amplitude information over a fixed period of time. If we were to take the individual snapshots of a spectrum analyzer and stack them one on top of another really, really fast, and turn the stack sideways while rotating it 90 degrees, then that’s what we would get with a spectrogram.
Along the y-axis, we have the same range of frequencies that a spectrum analyzer has. Along the x-axis, we measure the passage of time. We add a z-axis to show frequency, which is represented by color or brightness changes in a 2D display.
Because Words Will Only Get You So Far
I took a sound file and ran it through Sonic Visualiser, which is an excellent program for looking at sounds in a lot of different ways. From the snapshot I took of the sound file, I created this graphic:
Note: The waveform in (1) is a stereo waveform, that’s why there are two waveforms in the oscillator view.
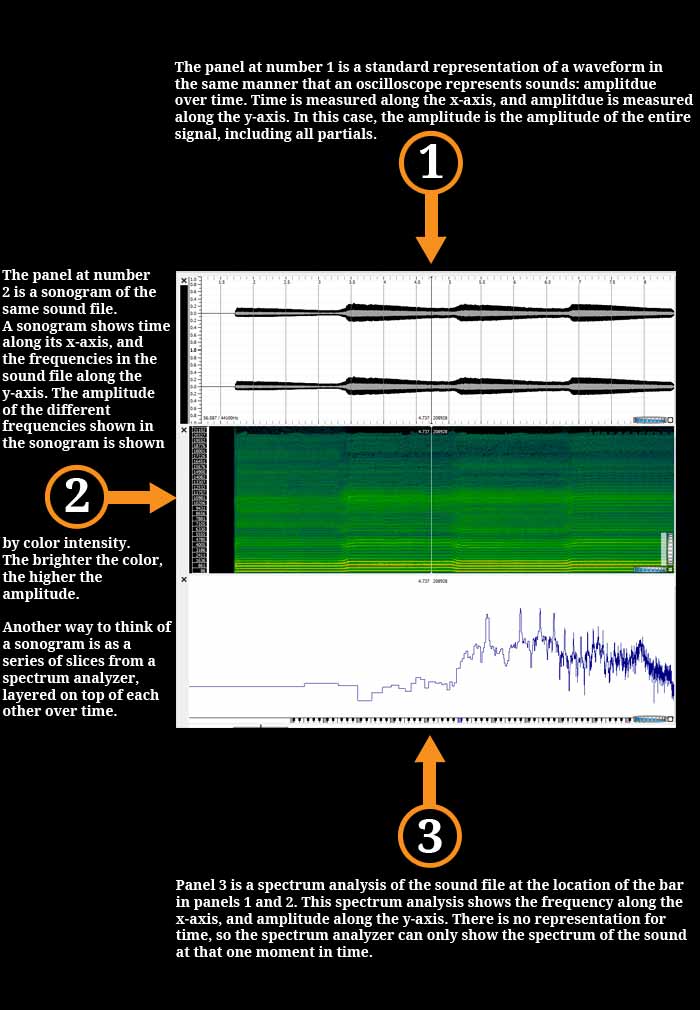
What’s interesting about the sonogram is that you can see the changes in the note sung very clearly as bands, but it would be almost impossible to do that with the oscilloscope or the spectrum analyzer. The oscilloscope can show you the attack and decay of the notes being sung, but it can’t tell you what notes were just sung. The spectrum analyzer can tell you what notes are being sung and how loud, but you have to look at a lot of slices.
I’m Reflecting, I’m Reflecting!
This took some time to put together. I had to set up an old domain I had lying around and hook it up to a new server, then install WordPress, then Suffusion, then customize everything. I even created a favicon.ico file in Photoshop. The favicon didn’t take too long, though.
I dug out Sonic Visualiser from my previous class on digital sound design and used Windows’ screen snapshot tool to get the screen grab from a random audio file I had lying around. I dumped that into Photoshop to create the other visuals and text. I tried to use Sketchbook, but the results were kind of nasty.
Then I went over the lecture, wrote up this post, and spent some time trying to disambiguate the info on oscillators.
Overall, I think I managed to lock the information into my head pretty well. I like the idea of thinking of a sonogram as a series of stacked spectrum analyzer snapshots, turned and rotated.
I put a lot of thought and work into this, but did I get it right? What parts do you like/not like? Let me know through the class! (Comments are disabled to dissuade comment spam-bots.)
Thanks for reading this. I hope you got something out of it!
-Rich.