Hi, I’m Rich from North Carolina, and today I’m going to talk about my project checklist for Propellerhead Software’s Reason 6.5.3, which is my digital audio workstation of choice.
1. File Handling. Name It and Save It Properly. Reason Handles the Rest.
Reason projects are saved as individual files that end with the .reason extension. The .reason file contains all of the sequencing, mixing, and mastering data, as well as any external files you have imported or recorded that aren’t being used as samples.
If I record some vocals in Reason and lay them down on a track, that vocal track will automatically be saved inside of the .reason file. Also, if I import some vocals I recorded elsewhere and lay them down on a track, that will also be saved inside the .reason file.
This is great if I’m the only person working on these tracks. It’s a really clean setup. There’s only one file to lose.
But if I want to be able to send the project I’m working on to someone else, they may not have all of the same patches and loops that I have. Reason makes it easy to work around this. Just go to File-> and select Song Self-Contain Settings.
A dialog box will pop up, showing which patches need to be included in the .reason file. Tick the check boxes next to the patches you want to include, hit OK, and you’re done! (You won’t be able to do this if only use the Factory Sound Bank patches, because everyone has those!)
Unlike other DAWs, you only need to use folders in Reason if you want to use them as a way to keep your stuff organized. I have a “Reason Projects” folder, and whenever I work in Reason and save something, I create a new subfolder based on the date. So today’s folder is 20130318. I’ll add tags to the folder name if I want to remember what I was working on and find it quickly, but the .reason file name can do the same thing.
2. Set Digital Audio Preferences.
Setting the sample rate is pretty easy in Reason. In Windows, go to the Edit menu, then all the way down to Preferences, and select it. On Mac, just go the Reason menu and select Preferences. Now the Preferences window will open up.
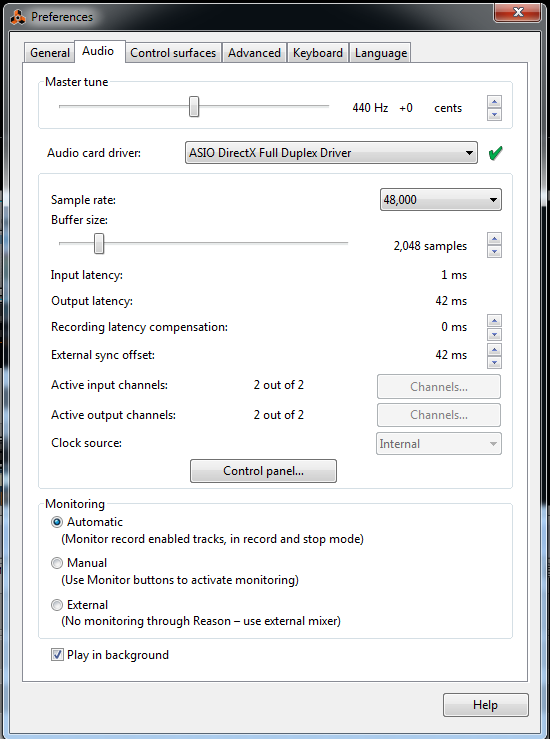
From here, you can select the Sample Rate from the drop down box. Available Sample Rates are based on your hardware. If your machine can handle it, then it will be available to you.
Selecting bit depth is a bit unique in Reason. Reason will automatically select the highest bit depth available to you based on your hardware. If it can do 24-bit audio, then it will record in 24-bit. If it can only do 16-bit, then it will do 16-bit.
If you want to check your bit depth, then click on Control Panel button. You can see what’s possible in the resulting dialog box.Reason isn’t too picky about sample rate or bit depth when it comes to working inside a project. It will automatically convert whatever you bring in to your selected sample rate and your possible bit depth. (So if you can only do 16-bit depth, 24-bit samples will be downsampled!)
3. Setting the Recording File Type
You don’t have to. Reason does this automatically for you in the background. If you want to export your recorded tracks, you can do so at any time, and you can choose from WAV or AIFF. (No support for Broadcast WAV files yet.) Also, when you export, you can choose whatever sample rate and bit depth you want.
4. Hardware Settings For Audio
Go back to the Audio preferences dialog box I showed above. This is where you can check to make sure your hardware is playing nicely with Reason. If you use the Audio Card Driver drop down menu, it will show you what’s available. A big green check mark means it’s working. (You may still not hear anything if you’re not routed correctly!)
The Control Panel button will show you the available bit depth.
Generally, for generic Windows sound cards and devices, the ASIO drivers are the most stable. The latency is terrible, though.
5. Set the Buffer Size
Once more, go back to the Audio preferences dialog box, and you can see the sample buffer slider bar. The number of samples you can use is totally dependent on your hardware and the driver you’re using. For my setup, the lowest number of samples I can use and still get usable audio is 2,048. That’s because I have a really cheap audio card on this computer. The latency is really high, and it’s distracting. I will fix this soon by getting a new interface with some decent speakers.
Generally, you should aim for 128 samples for recording to reduce latency, and 1,024 or higher for mixing and post-production.
Reflection
This was a bit tricky to write, because Reason isn’t like most conventional DAWs. A lot of the stuff I’m talking about here is stuff I don’t usually think about, because it’s all taken care of in the background. The only thing I usually need to check is the sample rate and the buffer size, so this was a good exercise for me. Now I feel like I know more about my DAW.