Apr 102013
 

Hi, this is Rich from N.C. again, for the last explanation of a topic from the Introduction to Music Production class on Coursera.com.

Today I want to compare some different software synthesizers in Reason 6.5, and show you where the various components are located. I’ll be showing you the main parts: the oscillators (VCO), filters (VCF), envelopes (ADSR), low-frequency oscillators (LFO), and the amplifiers (AMP).

SubTractor

I’m going to start with a very popular software synthesizer in Reason, the SubTractor. It’s a self-contained synthesizer, in that the parts are all laid out in a specific order, and you can’t change it. You can change the values, but not the order.

Subtractor

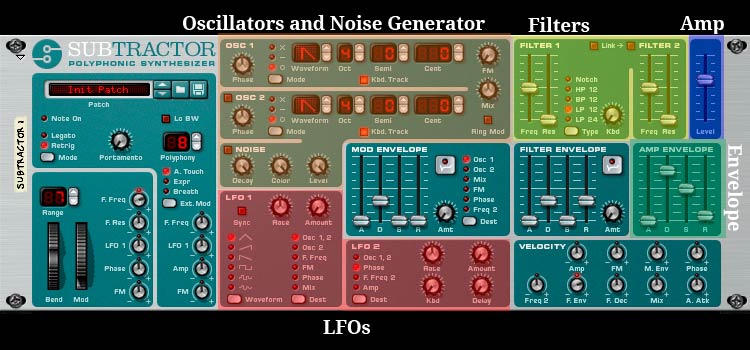
If you’ve watched the videos in class, you’ve seen the SubTractor already.

Antidote

Next up, one of my favorite software synths in Reason, Synapse Software’s Antidote. Antidote is also a self-contained synth.

Antidote2

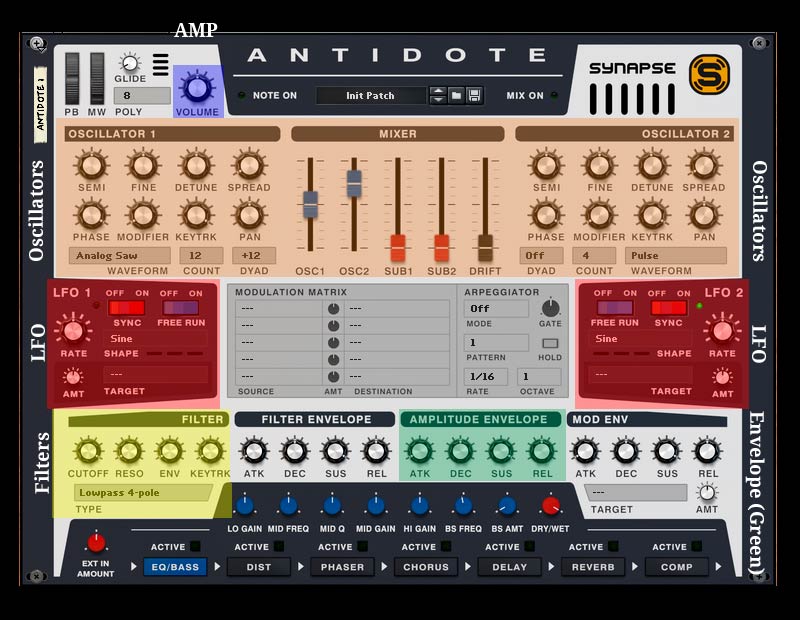
The layout is pretty straightforward here. Note that I have highlighted the “Volume” knob as the amp, because there really isn’t an amp section on this synth.

Thor

Next up is another classic Reason synth, Thor. Thor is a semi-modular synth. It differs from a self-contained synth in that you can change some of the parts from a set of fixed selections, and you can change the routing of the signal through the synth.

Thor

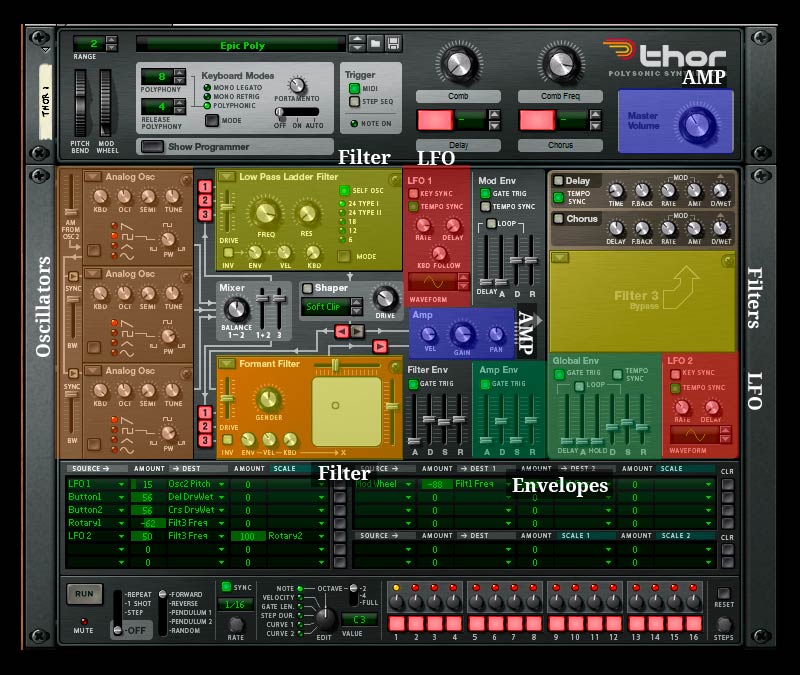
You can see where filter 3 on the right has no filter in it. You can create a filter from a drop-down menu, or choose no filter. In the same vein, you can change all of the oscillators to one of six types: analog, wavetable, phase modulation, FM pair, multi-oscillator, and a noise generator.

I highlighted the global and amp envelopes, because both can affect the amplifier. Take note of the differing design of the global envelope. There’s a delay before the attack, and a hold before the decay. This sort of envelope can do some really neat tricks.

The A-Series

I’ll end with the A-Series synth by OchenK. The A-Series is a modular synthesizer, and the first one available in Reason. You can mix and match the various components however you please, and route them however you like. It’s a bit intimidating at first, but I think it’s a great way to learn how synthesizers work.

Here’s the front:

A-Series-Front

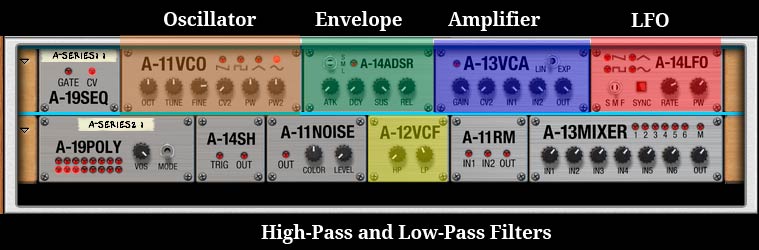
It looks simple and straightforward at first glance, but actually, each part of the synthesizer is an independent unit that functions on its own. To make a sound, you have to hook all of these units together, like this for example:

A-Series-Back

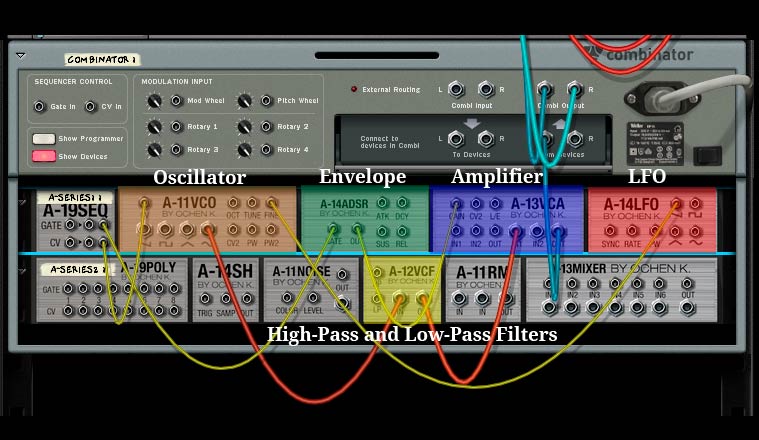
The green wires are virtual control voltage lines (or just CV), and the red and blue lines are virtual audio cables. You can see the signal comes in through the A-19 SEQ in the upper left, which receives the note on and value data from the MIDI keyboard. The gate carries the note on and note off MIDI signals to the ADSR envelope unit, which creates an envelope and sends it to the VCA (amplifier), which tells the VCA when to let the sound through (like controlling a virtual volume knob.)

The wire coming from the jack labelled “CV” on the A-19 SEQ carries the note pitch data. That goes to the VCO (oscillator) next to it, and the data tells the VCO what frequency to change to. The red cable carries the audio out to the A-12VCF, which contains a high- and low-pass filter, then the audio runs out from there to the amplifier. You select which waveform you want to use by running an audio cable out of it. I’m running a cable out of the sine wave oscillator. I could run cables out of all 4 oscillators to the A-13 mixer if I wanted to. (But that’s another demo.)

Finally, I connected the A-14 LFO (in the upper right corner) to the fine-tuning control of the VCO to create a little vibrato.

It looks complex, but you can learn a lot from it, and do even more. (You can even make an FM synth out of these!)

Reflection

I hope you learned a little bit about the software synthesizers in Propellerhead Software’s Reason 6.5. I decided to leave the filter and mod envelopes out of the discussion, and didn’t highlight them because they were a bit of an advanced topic.

You can also probably tell that I’m a big fan of modular synthesis.

This has been a very interesting and fun class. Good luck to everyone out there!

Apr 012013
 

Who doesn’t like a little noise in their music every now and then? I know I sure do, when used in the right way. What most of us don’t like, however, is noise messing up our perfectly good music in the wrong place.

Hi, this is Rich from North Carolina, and this time I’m going to talk about controlling noise so that it doesn’t get the better of your recordings.

You Can’t Escape It

Noise is everywhere, and it surrounds us all the time. Even if you go into the quietest of all quiet rooms, you will still hear the noises of your body (or maybe those of the person next to you!)

We want to reduce as much of the noise surrounding us as we can so it doesn’t impact our music negatively. Then later on, if we want to add noise, we can add it whenever or wherever we want.

There are two kinds of noise we’re trying to eliminate:

  1. Acoustic Noise
  2. Electrical Noise

Reducing Acoustic Noise

Acoustic noise comes from the common (and sometimes uncommon) sounds that surround us: computers, air conditioners, fans, appliances, motors, televisions, friends, relatives, and even pets.

So how do we get rid of all of this noise?

  1. Listen carefully to the room you want to use. How silent is it really? You’re trying to establish what the silence or room tone of the space is.
  2. Move away from noise sources. That computer starts to sound like a jet engine in a quiet room. Are the windows letting in a lot of noise? Is there a better space you can use?
  3. Create an isolated space for recording. I like to use my clothes closet for voice-overs, because it’s really quiet, and full of clothes on hangers that are eager to kill any noise in the room. I just hook up a mic to my interface, and hook that up to my laptop, and record what I need to there.
  4. Turn off sources of noise such as air conditioning, fans, heating (of all kinds– radiators can make random pinging noises, too!), television, and appliances.

Acoustic noise is everywhere, so it’s impossible to get rid of it completely, but you can limit it this way.

But that’s not the only noise you have to deal with.

Reducing Electrical Noise

Electrical noise comes out of every piece of gear you use. It’s noise that comes into your lines, and gets recorded right along with everything else. It can really mess up a recording, and be frustrating to deal with at times.

Almost all gear has a self-noise specification that will tell you just how much noise it generates. Better gear will generally generate less noise.

Here’s how to reduce it:

  1. Don’t use so much gear. Use the minimum necessary to get the job done. Every piece you add is going to make it noisier!
  2. Shorten the cable runs. The shorter the run, the less noise gets introduced. If you only need six feet of cable, run a six-foot cable. Don’t run a twelve-foot cable.
  3. Use balanced cables. Balanced cables are designed to reject noise. Unbalanced cables are not designed to reject noise. So if you have to have an unbalanced line somewhere, convert it to a balanced line as soon as possible with a good direct box.
  4. Turn off appliances and dimmer switches. Both dump a lot of noise into your power lines, which gets picked up by your equipment, then it winds up in your recording, and you have a headache on your hands in post. That hum you see at 50/60 Hz is probably coming from a loud power source.
  5. Use better gear. This usually works. Do your research before buying. Expensive gear isn’t always better. (It usually is, but it’s no guarantee.)

Avoid Unnecessary Gain Stages

That means leaving your mixer on U and not using it to boost signals. Gain stages add more noise.

If the sound coming in is too quiet, move the mic closer instead.

Generally mic use and placement can fix a lot of gain problems. Use the right mic for the job. Pick a polar pattern on the mic that will reject unwanted sounds, and only pick up the sounds you want to record. Directional microphones can be really useful in this regard.

Don’t Push It Off To Post

It may be tempting to use a filter or some other post-production strategy to reduce a noisy recording, but your best post-processing solution is not to introduce the noise in the first place.

Noise can be great as an effect, or as something to add into a synth, but it’s not so great when you can hear it in an unwanted place.

Control noise. Don’t be controlled by it.

Reflection

I’m not exactly sure how I can demonstrate how to reduce noise in a blog post, since a lot of this is pretty situational, but I can at least go over the points Loudon talked about in the lecture. I hope this helps!

Mar 102013
 

Hi, I’m Rich from North Carolina in the United States, and I’m going to talk a little bit about visualizing sound.

We all have various reasons for wanting to visualize sound at different times. We may want to understand a natural phenomenon, or find an annoying harmonic so we can get rid of it,  or figure out if the rhythm guitar is too loud, and needs to have its levels adjusted.

So how do we “see” sounds so we can understand them better?

Oscilloscopes

At first, we had oscilloscopes. What a hardware oscilloscope measures is the changes in a voltage signal over time. The signal strength is measured along the y-axis, and time progresses along the x-axis.

In terms of software, rather than as a voltage, we usually see the image of amplitude along the y-axis over time on the x-axis, since that’s more useful than voltage in terms of audio editing.

Either way, the oscilloscope is useful for measuring what is going to be sent out to your speakers, whether it’s in terms of voltage or amplitude. In our case, we’ll be using the amplitude variety more often.

Oscilloscopes are useful for finding the starts and ends of sounds, and for determining the average level of a sound, but they don’t give you any frequency or timbre data.

Spectrum Analysis

Next came the spectrum analyzer. The spectrum analyzer does a really good job of showing us an instantaneous snapshot of frequency and amplitude information. Generally, audio frequencies are lined up along the x-axis, and the y-axis measures the amplitude.

What the spectrum analyzer lacks is a way to show changes in frequency and amplitude over time.

In a DAW, you can often find spectrum analyzers available as add-on software.

Spectrogram/Sonogram

The spectrogram or sonogram has the richest presentation of audio data. It shows us frequency and amplitude information over a fixed period of time. If we were to take the individual snapshots of a spectrum analyzer and stack them one on top of another really, really fast, and turn the stack sideways while rotating it 90 degrees, then that’s what we would get with a spectrogram.

Along the y-axis, we have the same range of frequencies that a spectrum analyzer has. Along the x-axis, we measure the passage of time. We add a z-axis to show frequency, which is represented by color or brightness changes in a 2D display.

Because Words Will Only Get You So Far

I took a sound file and ran it through Sonic Visualiser, which is an excellent program for looking at sounds in a lot of different ways. From the snapshot I took of the sound file, I created this graphic:

Note: The waveform in (1) is a stereo waveform, that’s why there are two waveforms in the oscillator view.

waveform-analysis-image

What’s interesting about the sonogram is that you can see the changes in the note sung very clearly as bands, but it would be almost impossible to do that with the oscilloscope or the spectrum analyzer. The oscilloscope can show you the attack and decay of the notes being sung, but it can’t tell you what notes were just sung. The spectrum analyzer can tell you what notes are being sung and how loud, but you have to look at a lot of slices.

I’m Reflecting, I’m Reflecting!

This took some time to put together. I had to set up an old domain I had lying around and hook it up to a new server, then install WordPress, then Suffusion, then customize everything. I even created a favicon.ico file in Photoshop. The favicon didn’t take too long, though.

I dug out Sonic Visualiser from my previous class on digital sound design and used Windows’ screen snapshot tool to get the screen grab from a random audio file I had lying around. I dumped that into Photoshop to create the other visuals and text. I tried to use Sketchbook, but the results were kind of nasty.

Then I went over the lecture, wrote up this post, and spent some time trying to disambiguate the info on oscillators.

Overall, I think I managed to lock the information into my head pretty well. I like the idea of thinking of a sonogram as a series of stacked spectrum analyzer snapshots, turned and rotated.

I put a lot of thought and work into this, but did I get it right? What parts do you like/not like? Let me know through the class! (Comments are disabled to dissuade comment spam-bots.)

Thanks for reading this. I hope you got something out of it!

-Rich.